INSPECTION · ANALYTICS · ENGINEERING FOR THE ELECTRIC GRID

All your utility data on one secure platform you own — twin, analytics, and engineering on top.

Clear Horizon Energy un-silos your SCADA, MDM, CIS, GIS, and EAM data into one secure, utility-owned platform — then builds the digital twin, runs technical and financial analysis, and lets your teams work the data in the tools they already use.

FIELD INSPECTION UAS · LiDAR · 50MP · IR UTILITY SYSTEMS SCADA·MDM·CIS·GIS CONNECTIVITY MODEL Network topology YOUR SECURE DATA PLATFORM Un-siloed · curated · utility-owned DIGITAL TWIN Grid model ANALYTICS Technical + financial YOUR TEAMS Dashboards & BI

All your utility data, un-siloed — on a platform you own

SCADA, MDM, CIS, GIS, EAM, and other systems each hold part of the picture. We bring them into one secure platform — curated and documented — so your teams can finally use the data together. The twin, our analysis, and your own dashboards all run on it.

Un-silo your systems

Operations, customer, asset, work, and financial systems unified into one model instead of a dozen disconnected exports.

You own the data

The platform and its data belong to the utility — portable, exportable, and yours to keep.

Curated + documented

Cleaned, normalized, and organized into a reusable data dictionary your teams can build on.

Your teams, your tools

Analysts, engineers, operations, and finance work in Power BI, Tableau, QuickSight, Grafana, Python, or SQL.

Your data, no lock-in

Every study and inspection you buy from us lands on your platform and stays there. Walk away tomorrow and the curated data, the data dictionary, and the apps your teams have built are still yours.

Any format in — we do the ETL

Ingest→Normalize→Curate→Serve
SCADA / historian MDM · CIS · EAM GIS · Shapefile · GeoJSON · Geodatabase Milsoft & CYME exports SQL · NoSQL · CSV · Excel LAS/LAZ · GeoTIFF · RGB · IR REST / API feeds

On top of the platform: a living digital twin of your grid.

One model of the whole network — how it's wired and what's hanging on it, from the substation out to the last transformer. Inspection populates it, the analysis engine runs on it, and engineering draws from it. Like everything on the platform, it's yours.

Connectivity

Phase, topology, and switching — built from your connectivity model (Milsoft-compatible).

Assets

Poles, conductors, transformers, and hardware — located, attributed, and condition-scored.

SUB feeder healthy watch flagged
01

Poles & structures

Location, class, framing, lean, and loading from LiDAR and imagery.

classheightlean°loading
02

Conductors

Span, size, sag, clearance, and splice condition along the corridor.

sizespansagclearance
03

Transformers

Rating, phase, load, and a thermal/condition score for failure-risk ranking.

kVAphaseloadhealth
04

Switches & protection

Device type, state, and coordination role in the connectivity model.

typestateratingcoord

Three services, one platform

Inspection, analytics, and engineering are three ways of working the same twin. Start with any one; they compound when you combine them.

01

Inspection

Field data that resolves the defects other programs miss, fed straight into your twin as located, attributed findings.

  • Transformer & hardware condition
  • Corrosion, cracking & hotspots
  • Vegetation & clearance
  • Survey-grade LiDAR & land survey
UAS · LiDAR · 50MP+ RGB · IR/thermal
02

Grid Analytics

Real power-system modeling on the twin — not a dashboard of averages — with the financial analysis alongside.

  • Load flow & voltage studies
  • Hosting capacity & interconnection
  • Asset health scoring
  • Rate, cost & investment analysis
Runs on the live twin
03

Engineering

Engineering that starts where the survey ends — same geometry, same data, no re-survey and no hand-off gap.

  • Structural & clearance analysis
  • As-built & design support
  • Hardening & rebuild planning
  • Communications & SCADA design
  • GIS & mapping deliverables
Findings trace to an exact frame, point, or asset

Real power-system analysis, run on your twin

Load flow, voltage, and hosting-capacity studies on a model we build and keep current from your data — so you get the answers without owning the modeling software or its upkeep. The same platform holds your financial data, so cost, rate, and investment analysis runs alongside the technical work. Blinks and sustained interruptions are read as diagnostic signals about network health.

Analysis we run on the twin

Load flow
Power flow across the modeled feeder, under real load
technical
Voltage & imbalance
Profiles and phase imbalance along each feeder
technical
Hosting capacity
DER headroom by location — and where upgrades are needed
technical
Protection review
Coordination checks against the modeled topology
technical
Asset health
Condition & failure-risk scoring
inspection-fed
Financial analysis
Cost, rate & investment impact
platform-fed
Voltage profile along feeder — sample
nominal band substation feeder end below limit

What we find — and the data behind it

A sample of the defects our inspections surface, and the raw material we turn into condition scores and analysis. Click any image to enlarge; the point cloud is interactive — drag to orbit, scroll to zoom.

The raw material we turn into condition scores and analysis. The point cloud below is interactive — drag to orbit, scroll to zoom.

LiDAR — interactive · sample corridor
drag to orbit · scroll to zoom
Modeled grid render

Modeled grid — sample

A connectivity + asset model built from a live cooperative network.

Real networks, real data

The platform runs today on live cooperative data — not mock-ups.

Electric cooperative · Inspection + digital twin

A live twin built from the co-op's own engineering and GIS data

~152Kdrone photos tied to assets
~42KGIS assets across 31 substations
~320Knodes & edges in the connectivity graph

The network model was built from the cooperative's WindMil export and validated against its GIS. Every inspection photo — RGB and infrared — is linked to the asset it shows and its place in the network, with LiDAR available in an interactive viewer.

Electric cooperative · LiDAR + imagery inspection

2,000 miles of line, inspected in very rugged terrain

2,000 miof line inspected
LiDAR + imagerycaptured along the full corridor

Clear Horizon carried out LiDAR and imagery inspection across roughly 2,000 miles of line through very rugged terrain — the kind of corridor that's slow, costly, and risky to patrol on the ground.

Some customer names withheld. References available on request.
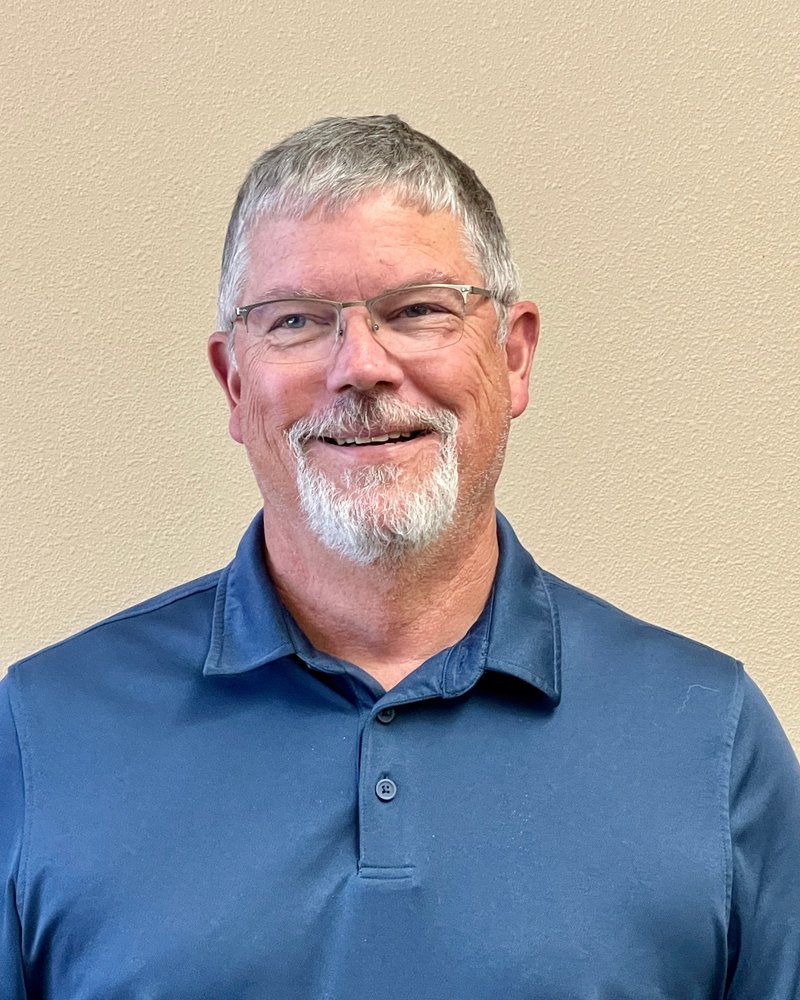
Stanley E. McHann, Jr.

Stanley E. McHann, Jr.

Founder · Clear Horizon Energy

Clear Horizon is founder-led, so you work directly with the person who designed the platform. Stan has spent his career where utility operations meet technology — as CTO of SparkMeter and of Milsoft Utility Solutions, Director of Technology at Landis+Gyr, and Senior Research Engineer and Chief UAS Pilot at NRECA.

Before that, an aerospace and avionics background in the U.S. Air Force and engineering roles at Tandem Computers, Dell Technologies, 3Com, and Cadence Design.

10 U.S. patentsIEEE papers · grid analyticsFAA Part 107Private pilotA&P certificated

Bring us a feeder. We'll show you what it's actually telling you.

Whether it's an inspection program, a modeling pilot, or an engineering study, we'll scope it around what your team needs to decide — and it all lands in one twin you own.

Request a capability review